

Download this file in: PDF | ZIP
1. Concept Mapping Activity I: What is a Concept Map?
Concept mapping is a study technique that helps a student, using what he or she already knows, to organize new information in a way that is meaningful to the student. This strategy also helps students develop organizational and analytical skil ls. The map itself consists of hierarchically organized boxes with single concepts inside, with the boxes connected by linking words that help describe the relationships among concepts.
Constructing a Simple Concept Map.
First skim through this investigation and look at some of the examples of the concept maps included. Note that the concept at the top is more general than the more specific concepts near the bottom of the map. Notice also that the linking word(s) between any two boxes present an understandable statement. Occasionally you will spot a cross link which links ideas spread horizontally on the maps. Notice the ways in which the maps are different from an outline.
Follow these steps as you construct a simple concept map:
1. Read the following paragraph(s) and identify or underline the main concepts; limit the number of concepts to 6 to 10.
2. Select the main concept and put it in the top box. Look for ways to classify the remaining concepts. Perhaps they could be ranked from general to more specific. Remember that there is no one best map; the map indicates the way you like to think about the relationships.
3. Branch off from the top concept with a couple of lesser concepts. Join each one of these concepts with a line drawn to the top box; alongside the line write in a linking word such as "includes", " leads to", "consists of " or other words that convey meaning to the relationship.
4. Look for opportunities to creatively cross-link from one branch of the map to another branch.
5. The following excerpt is from an article which you can access at http://uaos.erin.gov.au through the Australian Environmental Resources Information Network.
The greenhouse effect is a natural process. Greenhouse gases in the atmosphere trap the sun's warmth, raising the temperature on Earth by about 30 deg C. Without these greenhouse gases, the Earth would be much colder and inhospitable to plants and animals.
The problem is that humans are increasing the concentrations of some greenhouse gases in the atmosphere, and are adding new gases. Global measurements show that the concentration levels of greenhouse gases have been accelerating over the past century; there is mounting evidence that these increases are exaggerating the natural greenhouse effect and are causing an increase in the earth's temperature
The main greenhouse gases that are produced by human activities are: carbon dioxide, methane, nitrous oxide and ozone. Chlorofluorocarbons (CFCs), hydrochlorofluorocarbons (HCFCs) and perfluorocarbons are also greenhouse gases. These gases remain in the atmosphere for a very long time, and continue to contribute to global warming; for example, emissions today of carbon dioxide from fossil fuel burning today will still be in the atmosphere.
Improving your Concept map:
1. Explain your map to other students. Have them or her ask questions about your map, then switch roles.
2. Next, think about ways of improving your mapping approach. The following problems or concerns have been encountered by other students when they first began to concept map. What could you add to the list?
a. A misconception that there is one "correct" map or that two student maps should look alike.
b. The map has a stringy appearance. The map looks like a long string of boxes and linking words which are, in reality, just one long sentence.
c. More than one concept in a box defeats the purpose of clearly showing relationships among concepts.
d. Not including linking words often is an indication that the relationship between two concepts is only vaguely understood.
Optional Activity 2: Maps are displayed using Macintosh software, C-Map.
Try your hand at displaying your own concept map using a software program called C-Map. The software is obtainable from the WWW internet by accessing the Netscape browser. Under the File menu select Open Location and type in the following URL: http://hyperarchive.lcs.mit.edu/Hyper Archive/Archive/app/c-map.hqx
The files that you can download include the C-MAP software program developed by Scott Hunter and Howard Stahl, and a manual entitled Teach Yourself C-MAP by John Rethorst, Cornell University, August, 1995.
The following concept map, entitled C-Map(getting started)", suggests how you can quickly explore the C-Map software. The concept map directs you to highlight the C-Map and then select New under the File menu. Next you key in the following three keys all at the same time: Open Apple, Shift, and +.
Experiment with using the hand tool, the linker tool, and the eraser tool to construct your own concept map. Remember to save often!
Activity 3: The Big Picture
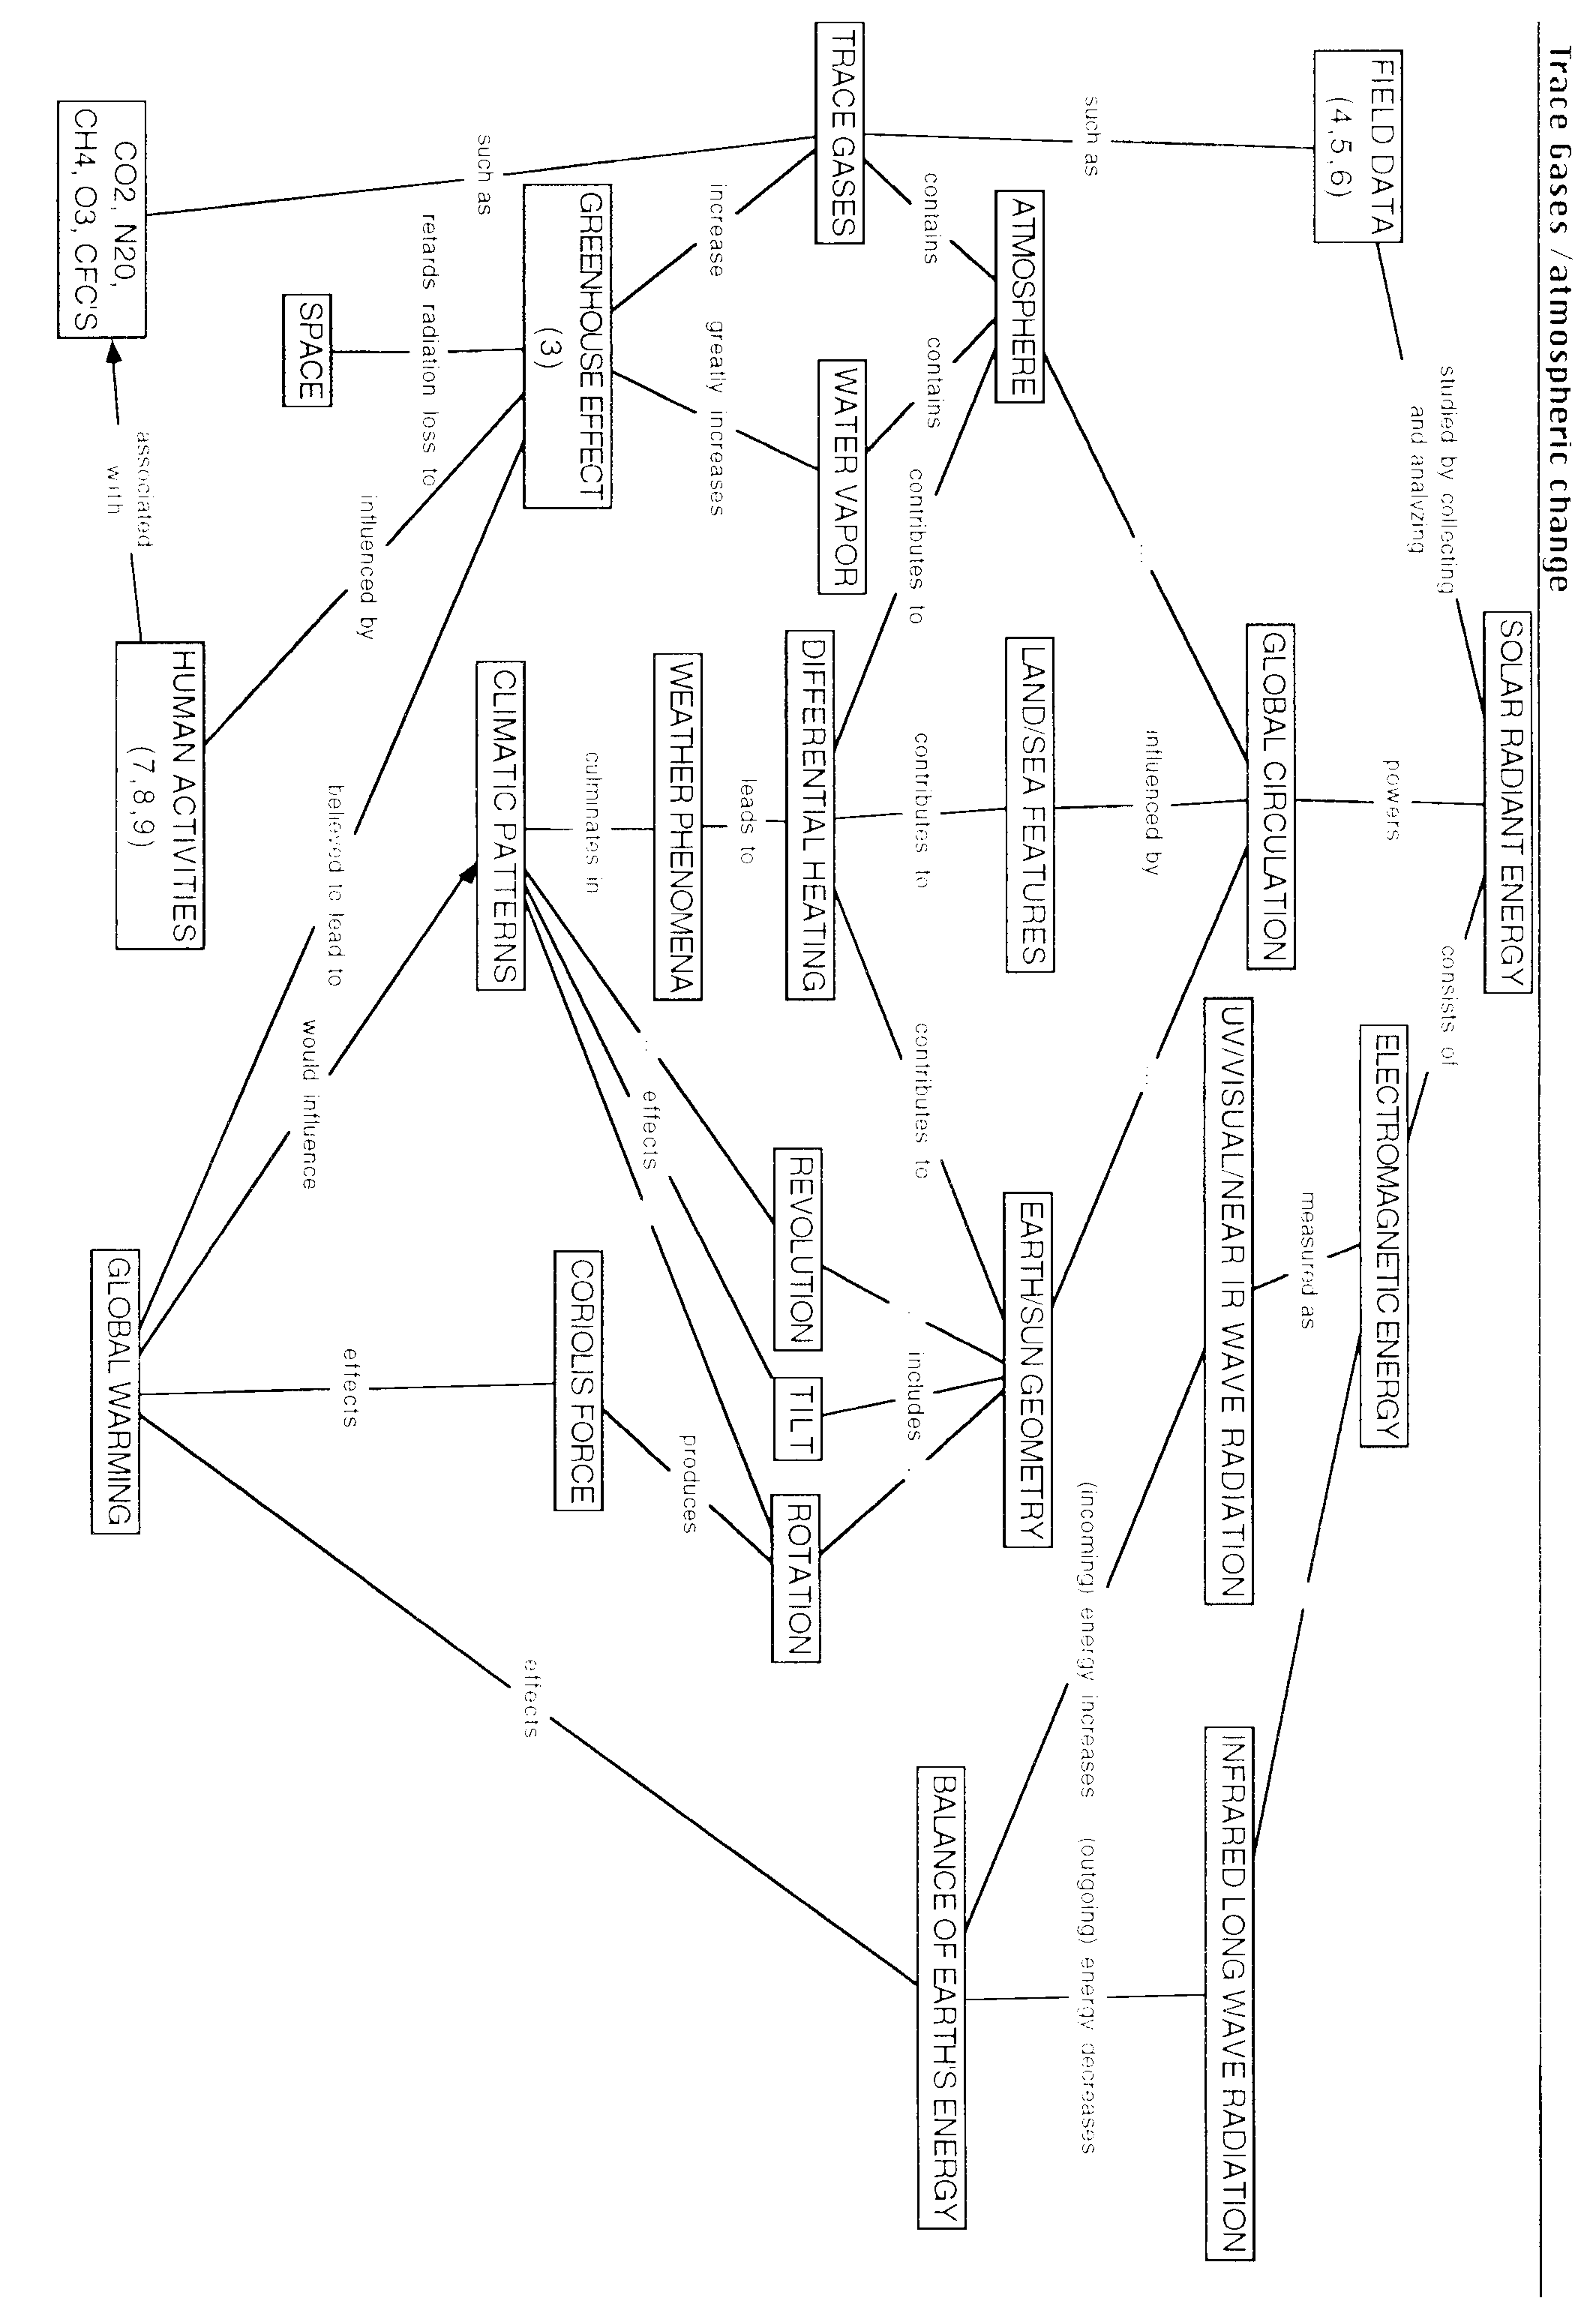
As a crew member of spaceship earth (rather than merely a passenger), you need to understand the various relationships involved in global atmospheric changes. The enclosed hand-drawn concept map represents the Trace Gases team's initial effort to map these concepts. The second map entitled "Trace gases/atmospheric change" provides a less complex version. Using this second map, begin at the top box and read down the map. Put question marks by concepts that you aren't familiar with and ask about these concepts during the class discussion. The numbers in the concept boxes refer to student activities that will be emphasized later in this module.
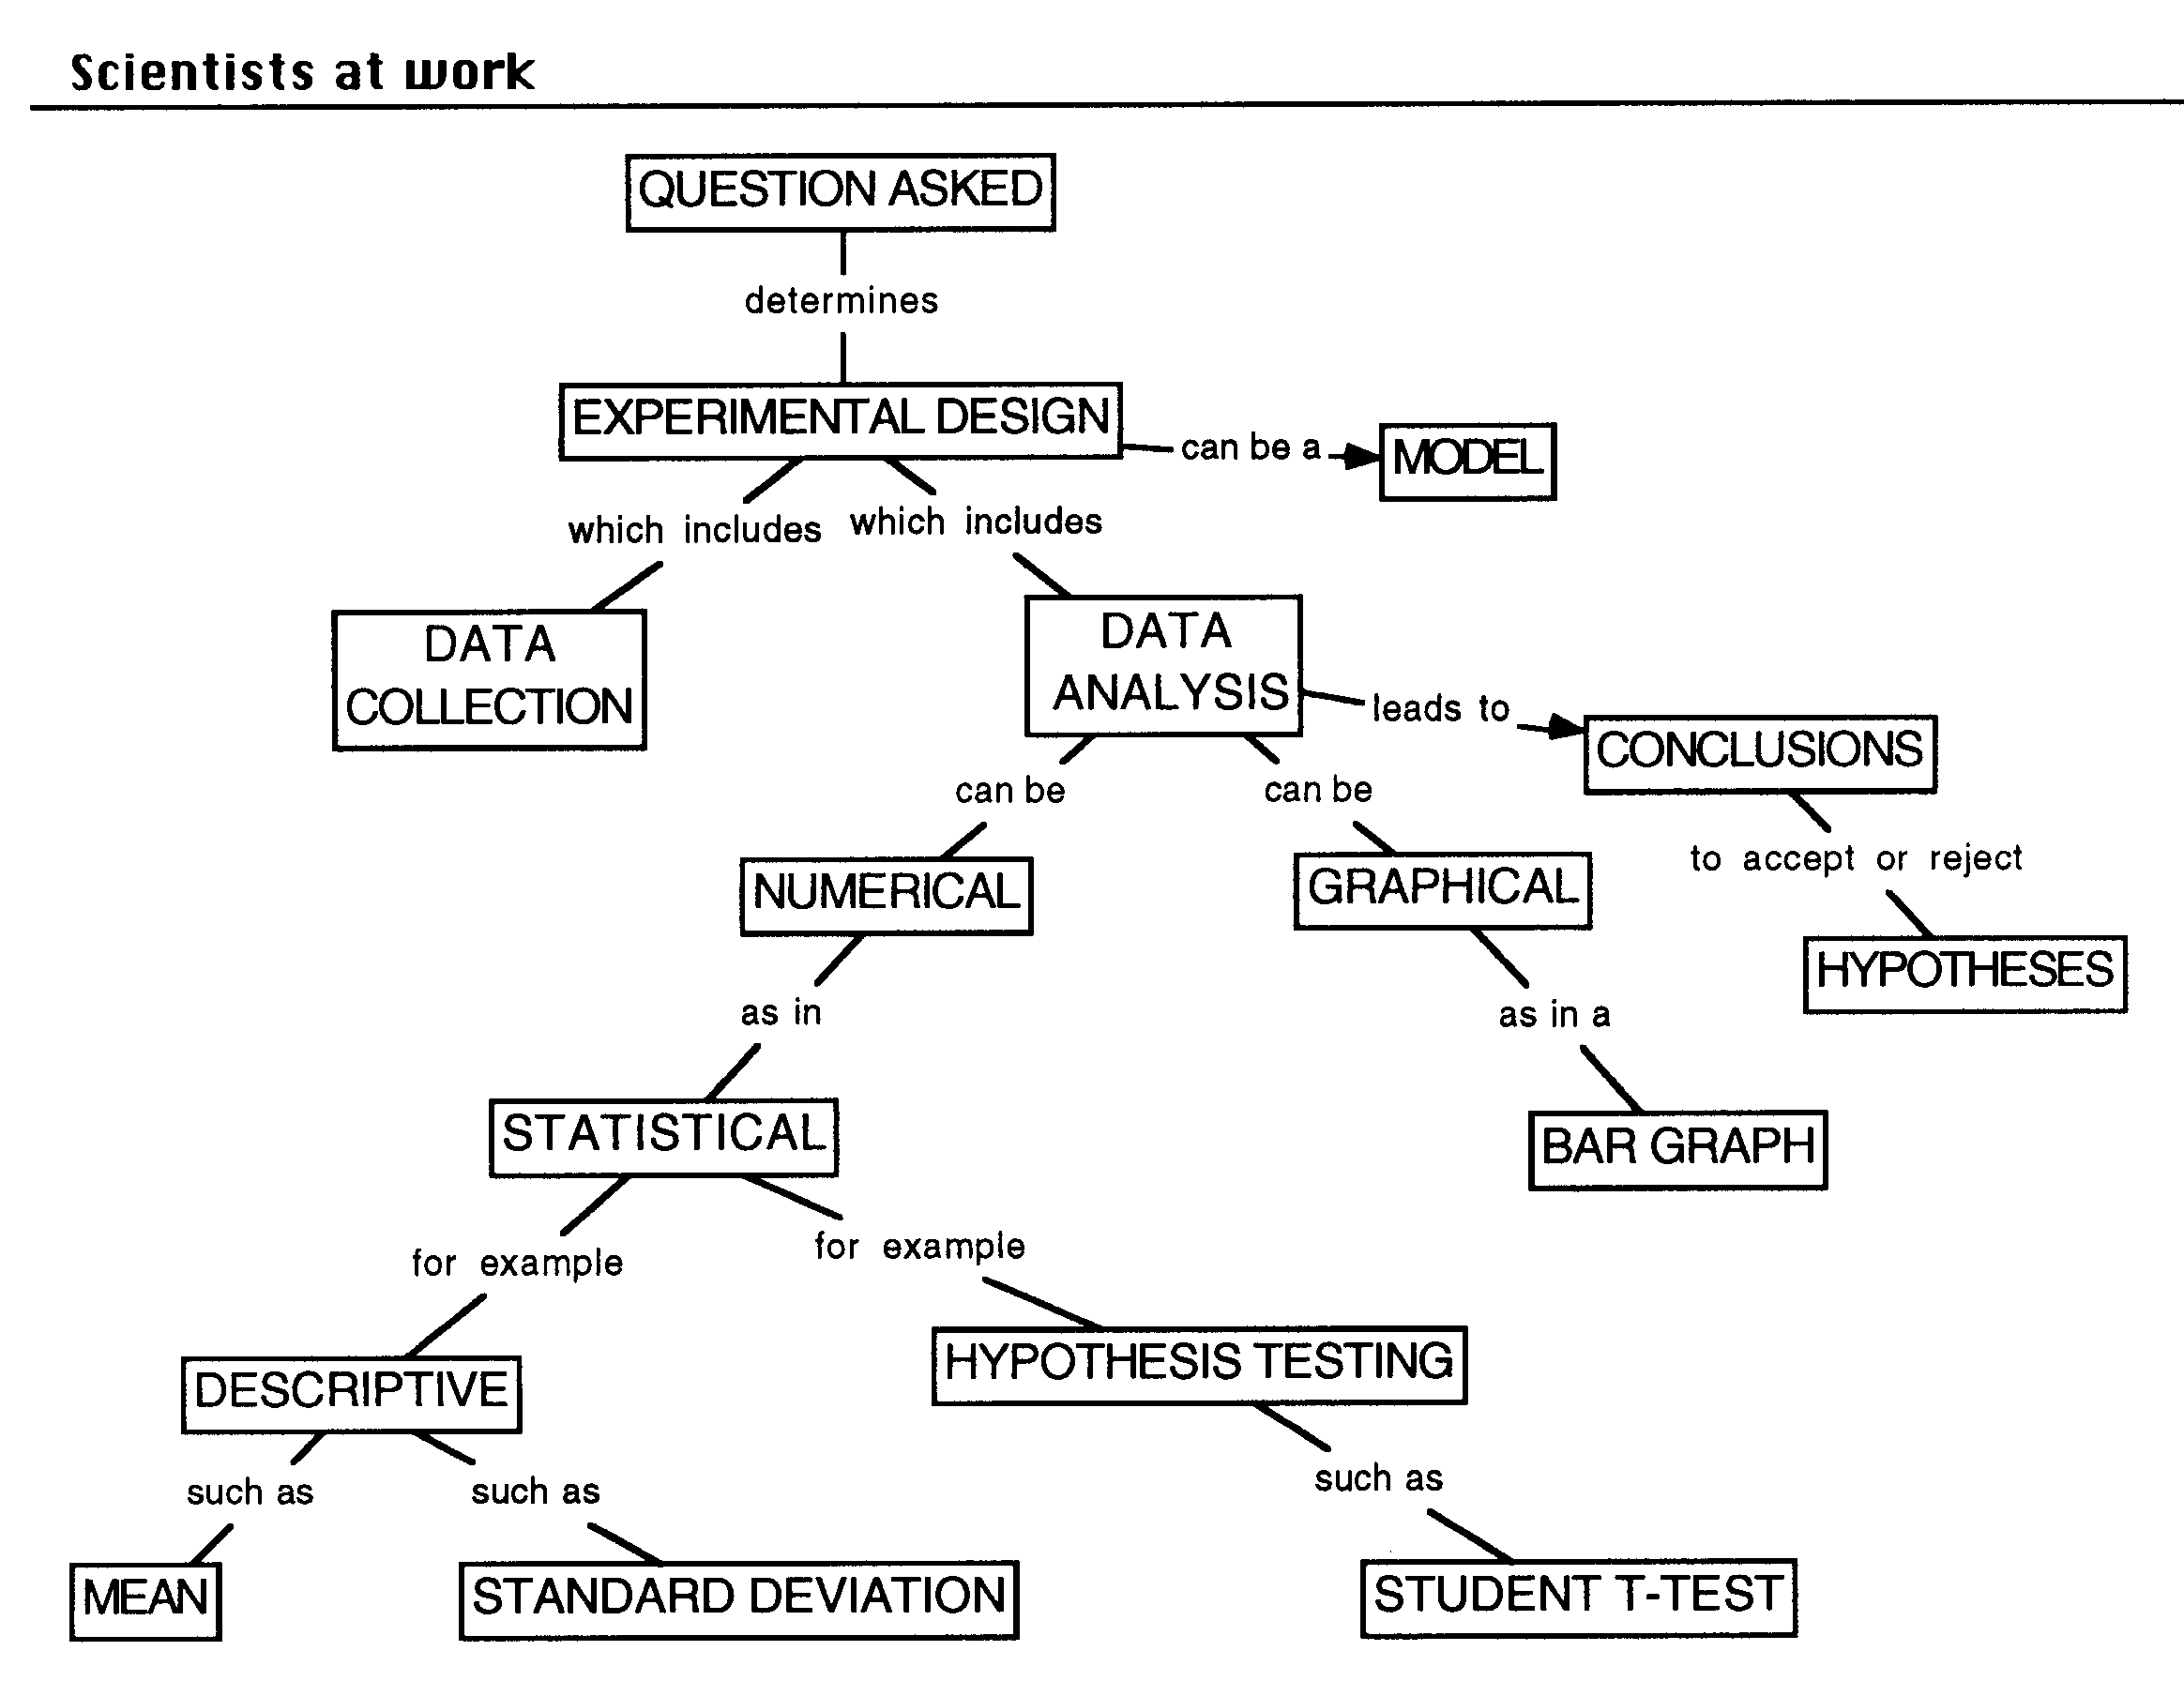
The third concept map called" Scientists at work" depicts one version of how science research is conducted. As shown in the map, the process begins with asking a focus question which helps determine the type of experiment that will be conducted. Your task is to work in a small group to identify a focus question about trace gases and then briefly describe your proposed experimental design. For example, some of the schools presently collecting trace gas samples might ask whether there is a difference in trace gases concentration between the wet season and the dry season. Use the "Scientists at work" map to make sure that you address the major parts of the scientific process. After you finish, share your group's research plan with the rest of the class.
GLOBE Teacher's Key:
After completing the concept mapping activities the students will be able to:
1. Identify key concepts in an article.
2. Arrange these concepts in a hierarchy and link the concepts together in an understandable manner.
3. Construct simple concept maps that reveal the student's understanding of the interrelationships among various concepts such as trace gases, greenhouse effect and global warming.
4. Identify a research question and design an experiment to answer the question.
Appropriate grade levels: Middle school and high school.
Prerequisite skills: Willingness to switch from outlining information to try a new approach for constructing and understanding meaningful relationships.
Time needed: Instruction regarding the mechanics of concept mapping could be completed in a one hour period; however, the students and teacher will need to use this technique for several weeks in order to develop the necessary skills and insight to appreciate the advantages of being responsible for their own understanding of science concepts.
Comments for Teachers regarding each Student Activity :
Activity 1. Two supplementary concept maps are included for your possible use in introducing concept mapping. The hand-printed map represents the Trace Gas Project team's working understanding of the major concepts related to changes in climati c p atterns. This map was used to help plan which activities and lessons were needed. The second map, "Trace gases/atmospheric change" was produced using the Macintosh software called C-map. This map will be useful to you and your students as an advanced organizer for review of the major science concepts associated with trace gases and climatic patterns.
Additional information on concept mapping is available under the Appendix A- Concept Maps and Concept Mapping - section on the WWW homepage for the Penn State College of Education Global Atmospheric Change. The URL is http://www.ed.psu.edu/dept/ci/sts/toc.html
A second source for introducing concept mapping is available at the University of Wisconsin Sea Grant WWW site located at: http://www.seagrant.wisc.edu/Communications/Publications/publications.html
Another source of concept mapping information is Joseph Novak's article entitled, "Clarify with concept maps", The Science Teacher; v58n7, p44-49, October 1991.
Optional Activity 2. The C-Map software is free and teachers are encouraged to download this Macintosh based program which is simple to use and thus encourages students to revise their maps over time as they understand the content better.
Activity 3. In this activity your students will need some help in understanding the various relationships depicted in both the "Trace gases/atmospheric change" map as well as the "Scientists at work" map. If possible let different groups present their proposed research design related to trace gases. The following curriculum resources may be useful for you to adapt for your classes:
An alternative source for curriculum ideas on global atmospheric change resulted from a series of NSF funded Leadership Institutes conducted under the direction of Dr. Peter A. Rubba, Dr. James A. Rye, both at Penn State College of Education, and Dr. Randall L. Wiesenmayer, West Virginia University. Successive groups of middle school science teachers helped develop and test 11 foundation/awareness lesson dealing with STS issues and examples. In addition 15 investigative lessons were written in which students developed skills to explore science technology and societal issues (STS). The series is capped by six action lessons in which students investigate various types of actions that can be taken, and decide what action they would be willing to take in regard to the issue.
A concept map, entitled "PSU Global Atmospheric Change", is included in this present module to suggest how the PSU lessons might tie in with the Trace Gases module. This map includes the 15 investigative lessons beginning with solar radiant energy (lesson 5). These PSU lessons can be retrieved from: http://www.ed.psu.edu/dept/ci/sts/toc.htm
A second WWW site for lesson plans is Access Excellence located at http://www.gene.com:80/ae/ This site for biology teachers is supported in part by Genentech, Inc. At the homepage, you might wish to select the search option and enter a key word, of your choice, to access "Rainforests of Madagascar: Role Playing and Decision Making".
Post Module Activity 4. The following use of concept mapping, as an alternative assessment, allows students to be tested in a way similar to how they were instructed. Concept mapping also is a means of testing critical thinking skills. The concept map produced by a student should reveal any misconceptions or alternate world view. You should look for evidence of a hierarchy, correct propositions, and the use of linking and cross linking words. If you are interested in a more formal scoring plan, see the paperback by Joseph D. Novak and D. Bob Gowin, Learning how to learn. Cambridge University Press, Cambridge, 1984.
Consider giving the following assessment assignment:
Students: Investigate your understanding of the trace gases in the atmosphere by developing a concept map using the following concepts or others that you feel need to be included:


