
Creating
the Context
Home
Research Focus
Background Info
Research Methods
Data Submission
Results of Study
Data Analysis
Conclusion
Further Research
Guided
Research
Research Question
Background Info
Research Methods
Data Submission
Results of Study
Data Analysis
Conclusion
Further Research
Research Values
Student
Research
Doing Research
Publish
View
Tools
Discussions
Stream Teams
Water Links
|
|
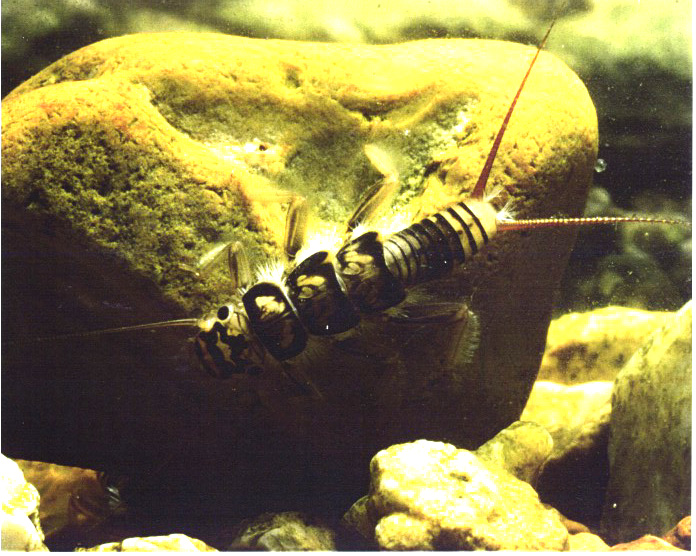
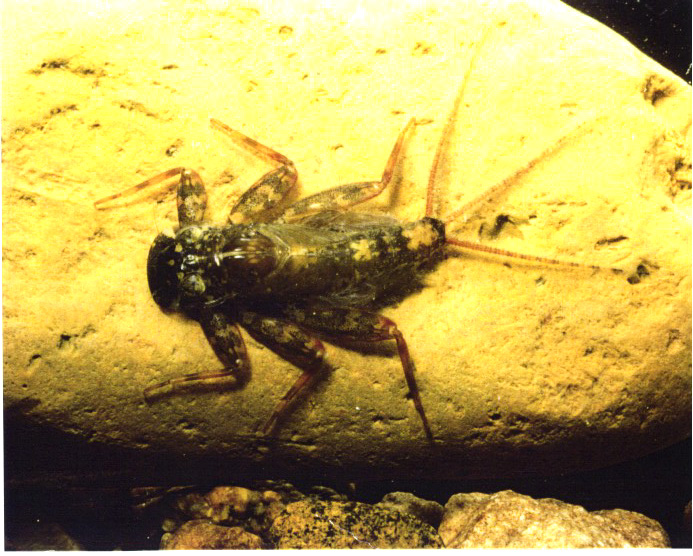
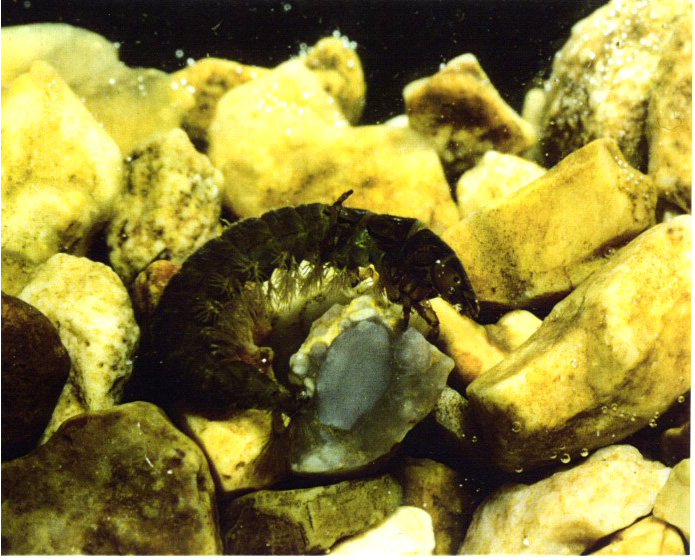
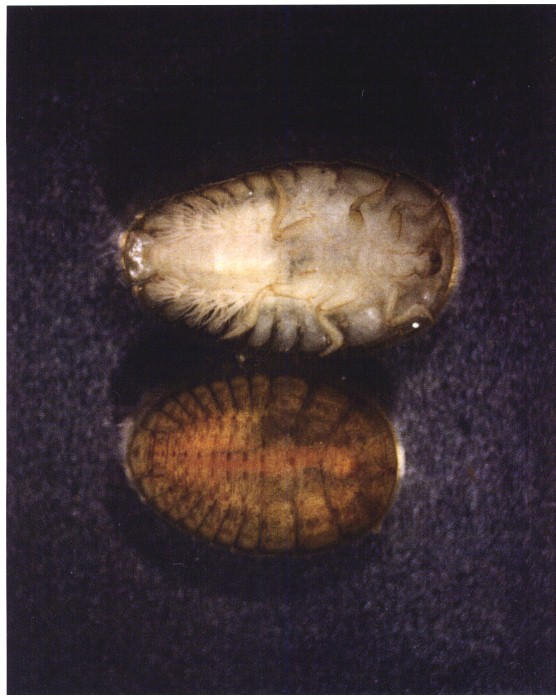
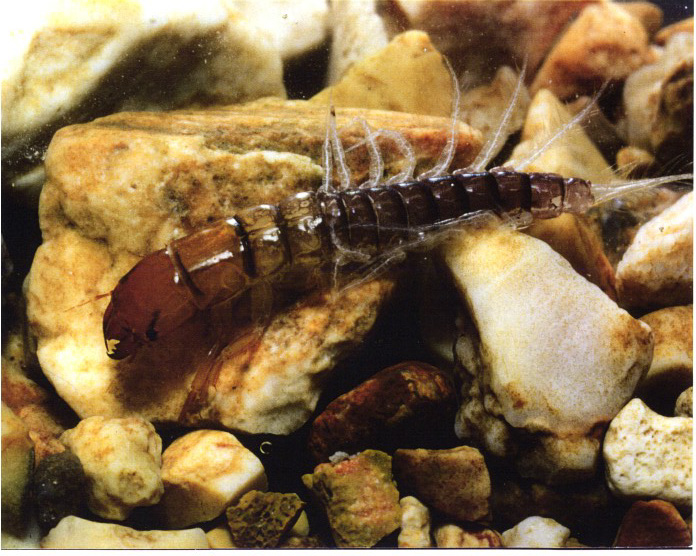
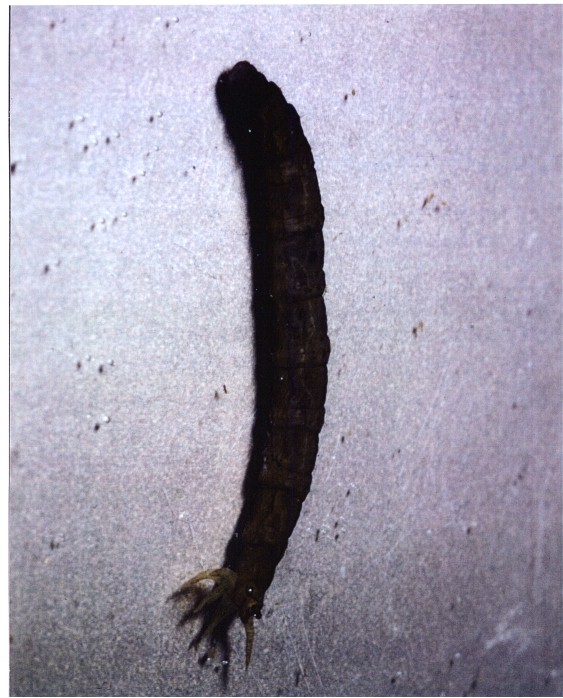
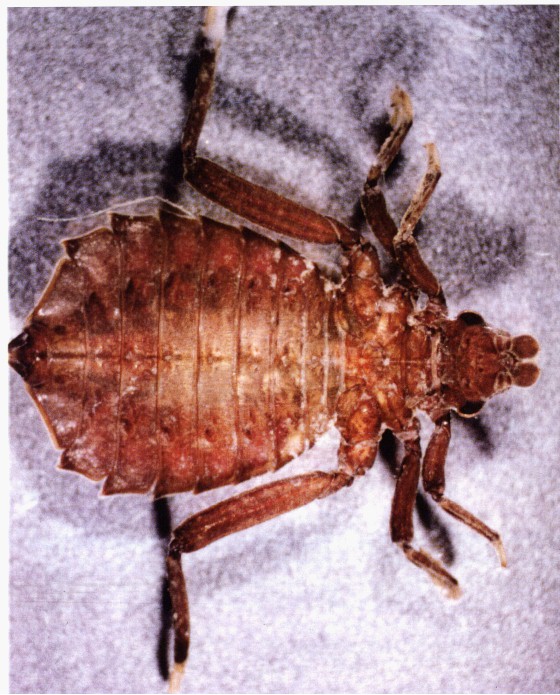
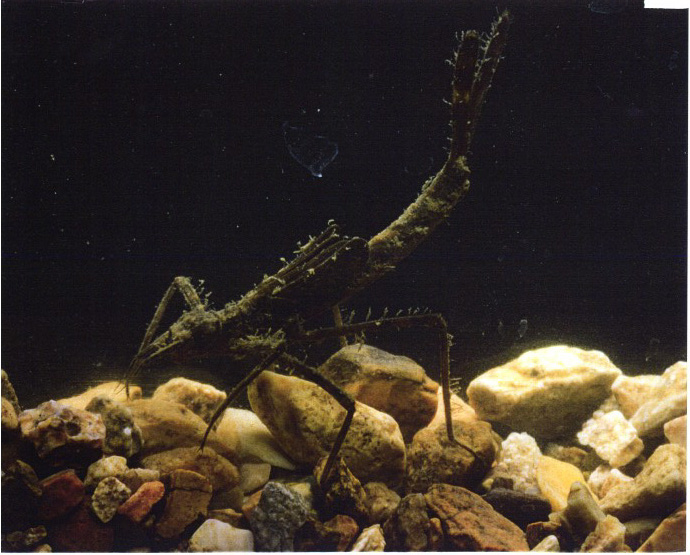
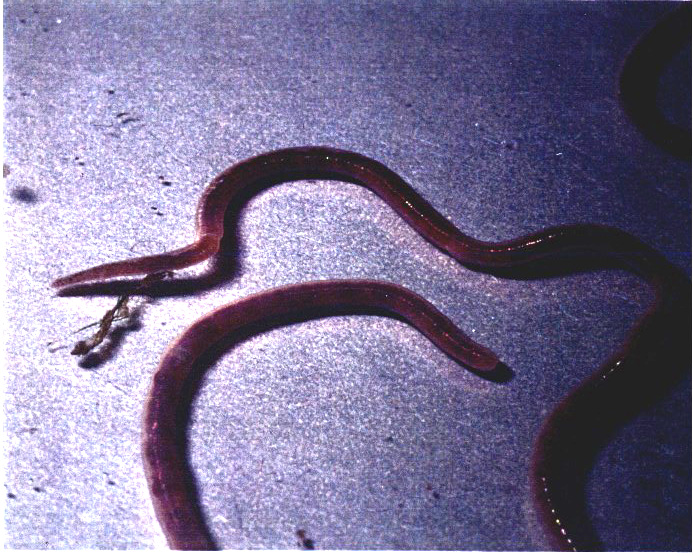
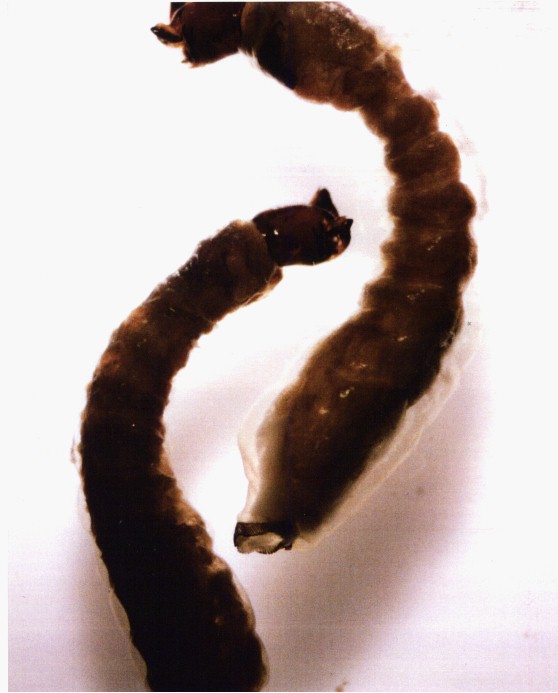
Biological Monitoring Research Methodology
[Biological Monitoring Background]
- Date:_____________________ Collector:___________________________
- Stream Name:________________________(city and/or county):___________________
- Landmarks and Description of Sampling Site:
- The sampling site is in(woods, meadow, yard, etc.):
- Weather Conditions This Date:
- Temperature of the Stream (Degrees Celsius or Fahrenheit):
- Width of Stream at Sampling Site (meter.centimeter):
- Depth of Stream Center at Sampling Site (meters.centimeter):
- Stream Flow: Swift Moderate Slow
- Are there fish in the stream? Yes No
- Are there plants in the water? Yes No
- Plants on stream bank:
Trees Grasses Flowers Shrubs
None
- The water is: Clear Muddy Cloudy
Oily
- Is there trash around or in the sampling site? Yes
No
- Describe the trash:
- Additional Observations:
Assessing the Stream's Health
Directions for Part One:
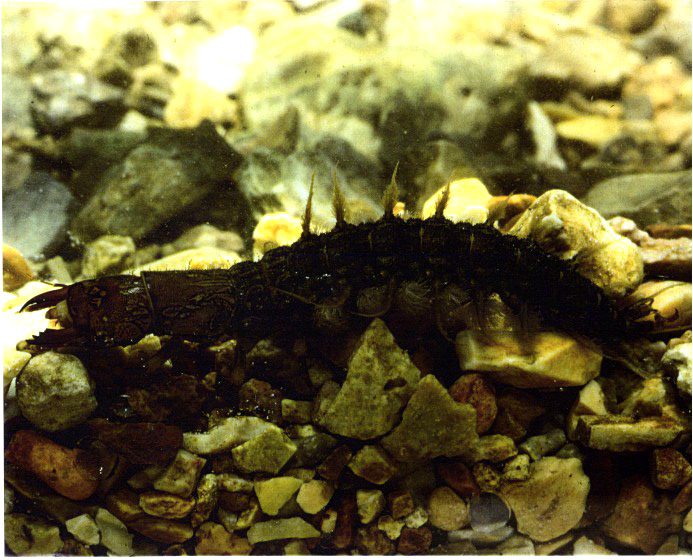
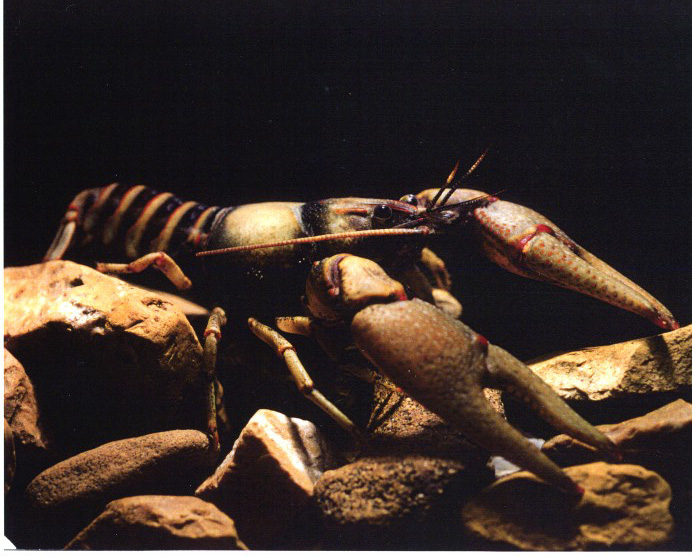
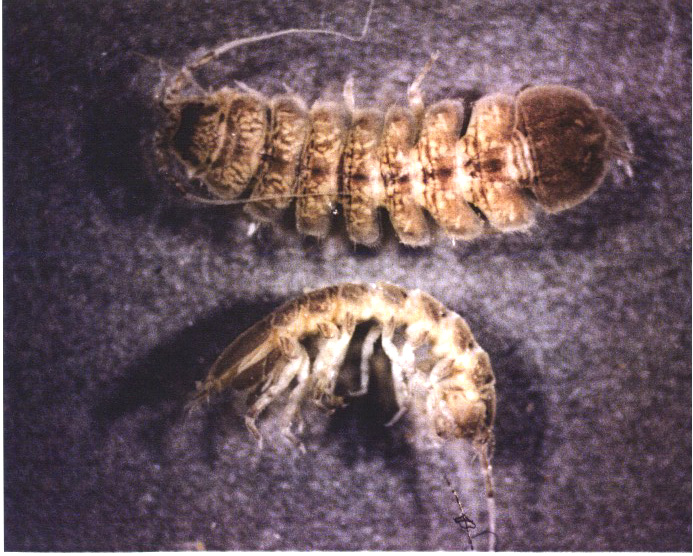
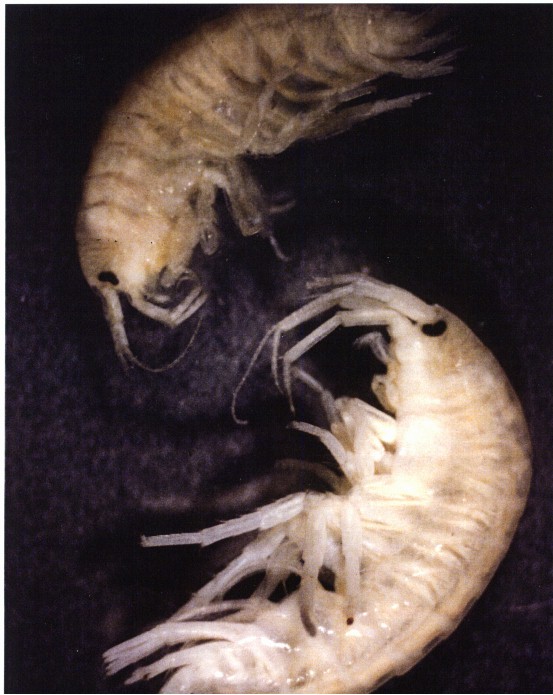
Identify the Macroinvertebrates found at the
stream sampling site using the form or the identification key, and put the number of each type
in the box beside the name of each type you find. Count how
many you have of each type and record the total on the line.
Directions for Part Two:
- Enter how many different types (not the number of each type) of macroinvertebrates you checked in each sensitivity group above.
- Multiply by the number in the table to get a group score.
- Add the three group scores.
- Look at the total score and circle the correct rating.
| Sensitivity Groups | Number
of
Types | Scoring Value | | Group Score |
| Very Sensitive | |
3 | = | |
| Somewhate Sensitive | | 2 | = | |
| Not Sensitive | | 1 | = | |
| | |
Total Score | = | |
| Excellent | Good |
Fair | Poor |
| (23 or more) | (17 - 22) |
(11 - 16) | (10 or less)
|
|
